Analysis
Every post, newest first. Stock analyses carry a research ID and a public review schedule — see the Research Tracker for thesis status.
-
 CRAI Stock Analysis RES-2026-026 2026-08-22
CRA International: The Expert Witness Economics Firm Hiding in Plain Sight
CRA International earns $752M annually advising courts and regulators through Ph.D. expert witnesses. A 'Consulting Services' screener label keeps the litigation economics franchise chronically under-covered at 2 Wall Street ratings on a $1.1B market cap.
-
 BH Stock Analysis RES-2026-025 2026-08-08
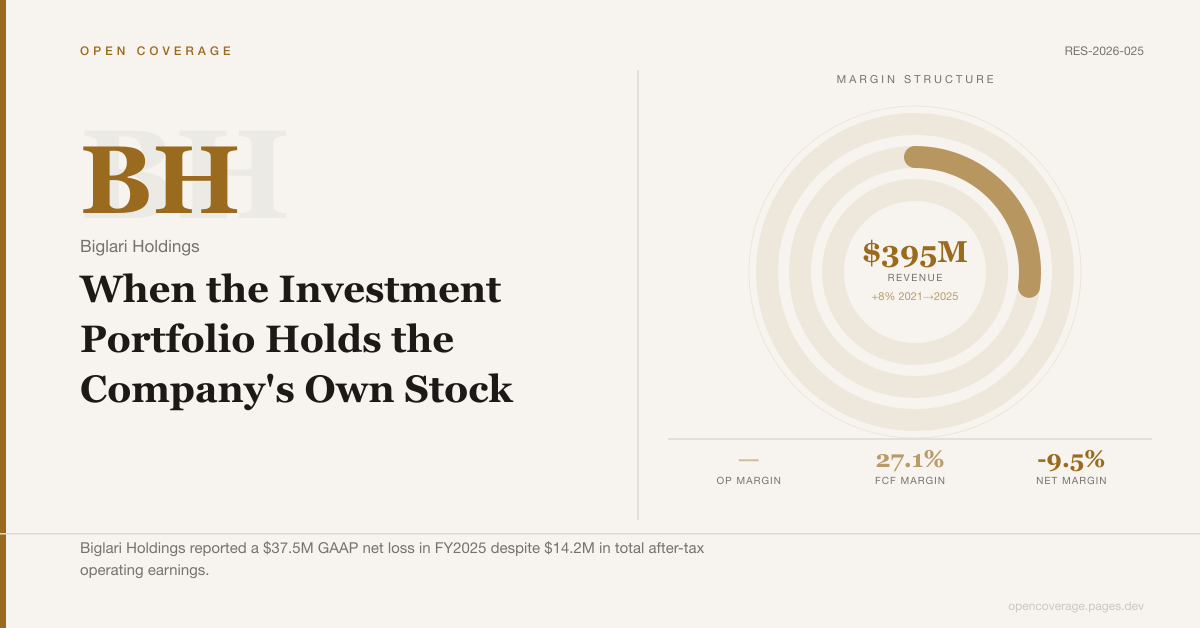
Biglari Holdings (BH): When the Investment Portfolio Holds the Company's Own Stock
BH's -$67M pre-tax investment line reflects a real loss on the fund's third-party holdings. But BH's interests in the Lion Funds simultaneously had $150M in gains on BH's own stock that accounting eliminates—making the total portfolio up $83M while GAAP shows a loss.
-
 JBSS Stock Analysis RES-2026-024 2026-08-06
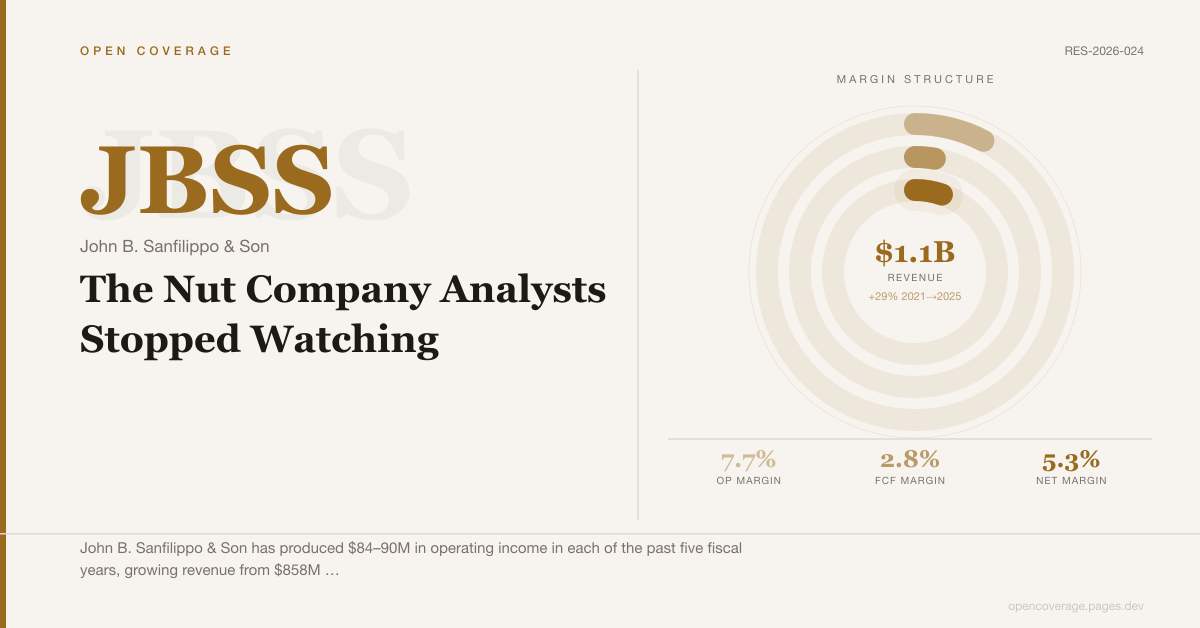
John B. Sanfilippo & Son (JBSS): The Nut Company Analysts Stopped Watching
JBSS has generated $84–90M in operating income every year for five consecutive fiscal years on $1.1B in revenue. One to two analysts cover it. The reason is structural—but the valuation reflects it.
-
 DJCO Stock Analysis RES-2026-023 2026-08-05
Daily Journal Corporation (DJCO): The Newspaper That Became a Court SaaS
80% of DJCO's $87.7M revenue now comes from case management software in 37 states, yet screeners still show a newspaper company holding a bank stock portfolio. Here's why the operating business stays invisible.
-
 Sector 2026-08-04
Two Compounders the Screens Can't Read
Winmark and Value Line both earn extraordinary net margins and have had no institutional consensus for years. The screener can't find either — but the mechanism is completely different for each.
-
 DGICA Stock Analysis RES-2026-023 2026-08-04
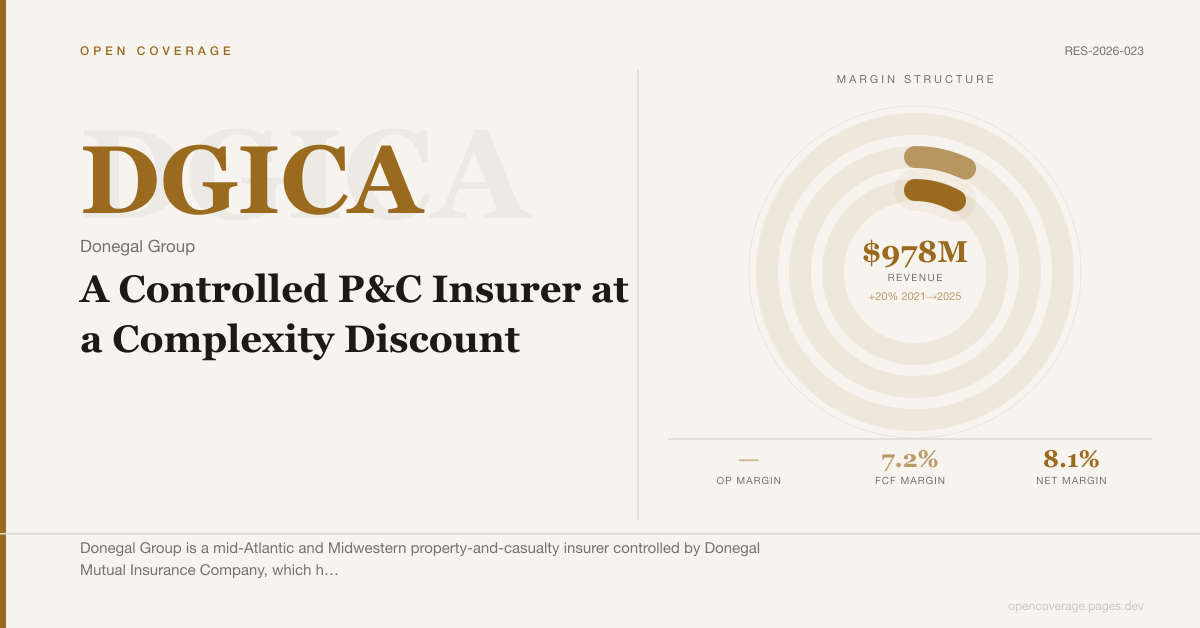
Donegal Group (DGICA): A Controlled P&C Insurer at a Complexity Discount
Donegal Mutual's 70% voting control and an intercompany pooling arrangement have kept active sell-side coverage away from DGICA. Behind the structural complexity sits a P&C franchise that turned in a 95.4% combined ratio in FY2025 — its best underwriting result in at least five years.
-
 Sector 2026-08-04
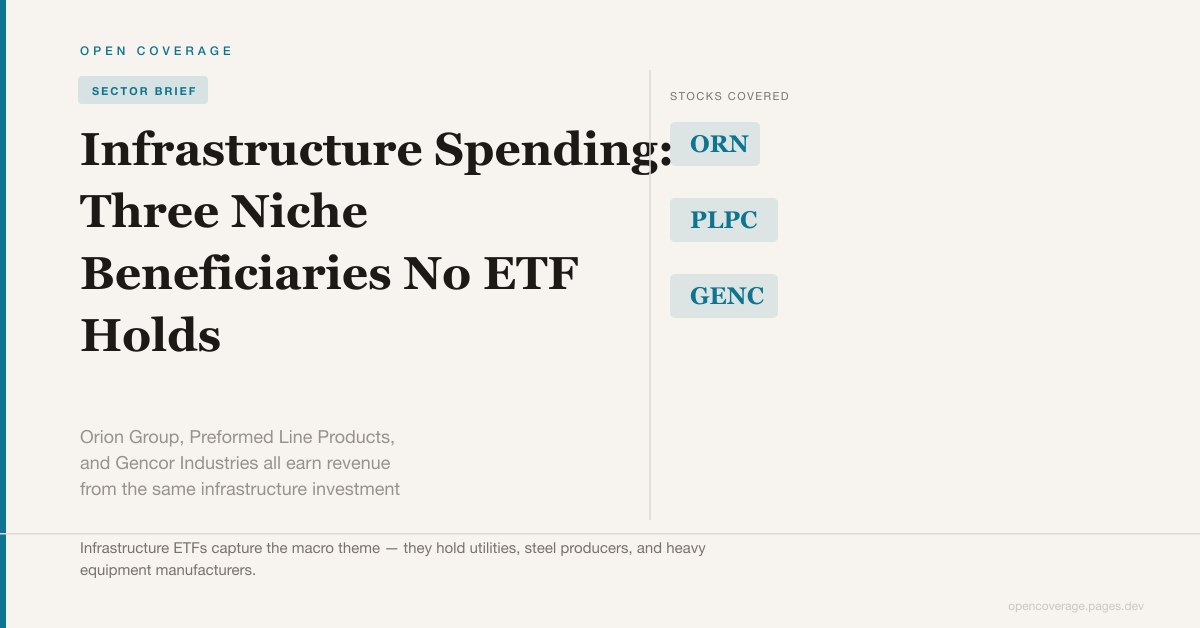
Infrastructure Spending: Three Niche Beneficiaries No ETF Holds
Orion Group, Preformed Line Products, and Gencor Industries all earn revenue from the same infrastructure investment cycle. None of them appear in infrastructure ETF indexes. The reasons are different for each.
-
 Sector 2026-08-04
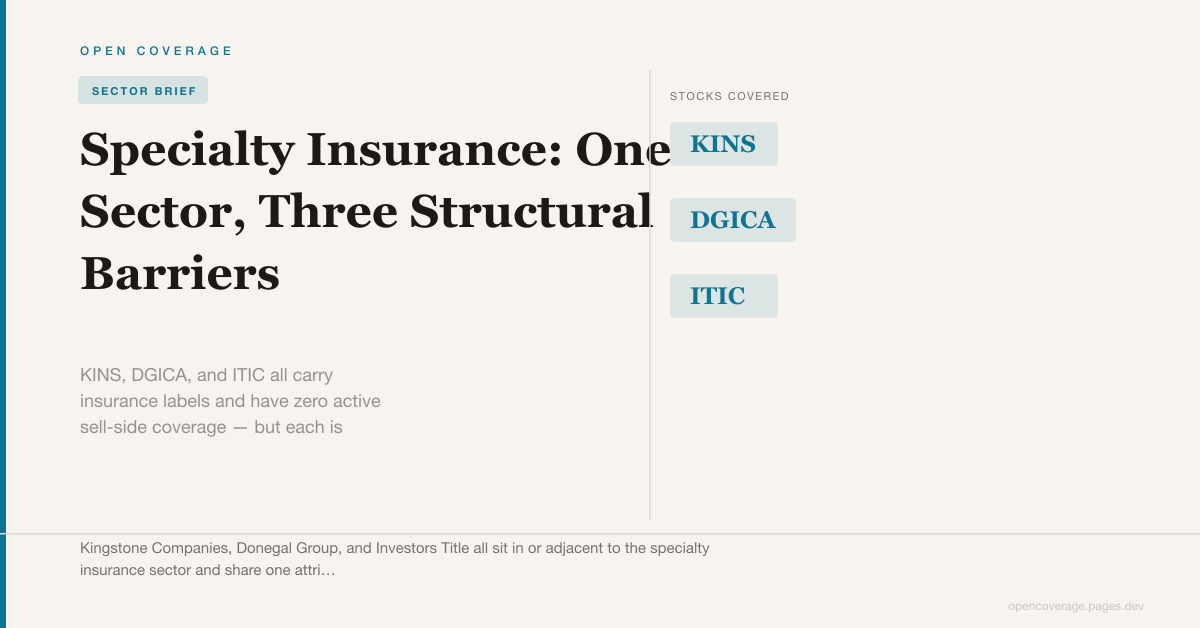
Specialty Insurance: One Sector, Three Structural Barriers
KINS, DGICA, and ITIC all carry insurance labels and have zero active sell-side coverage — but each is invisible for a different structural reason: trailing losses, controlled-company complexity, and float mechanics.
-
 YORW Stock Analysis RES-2026-022 2026-08-03
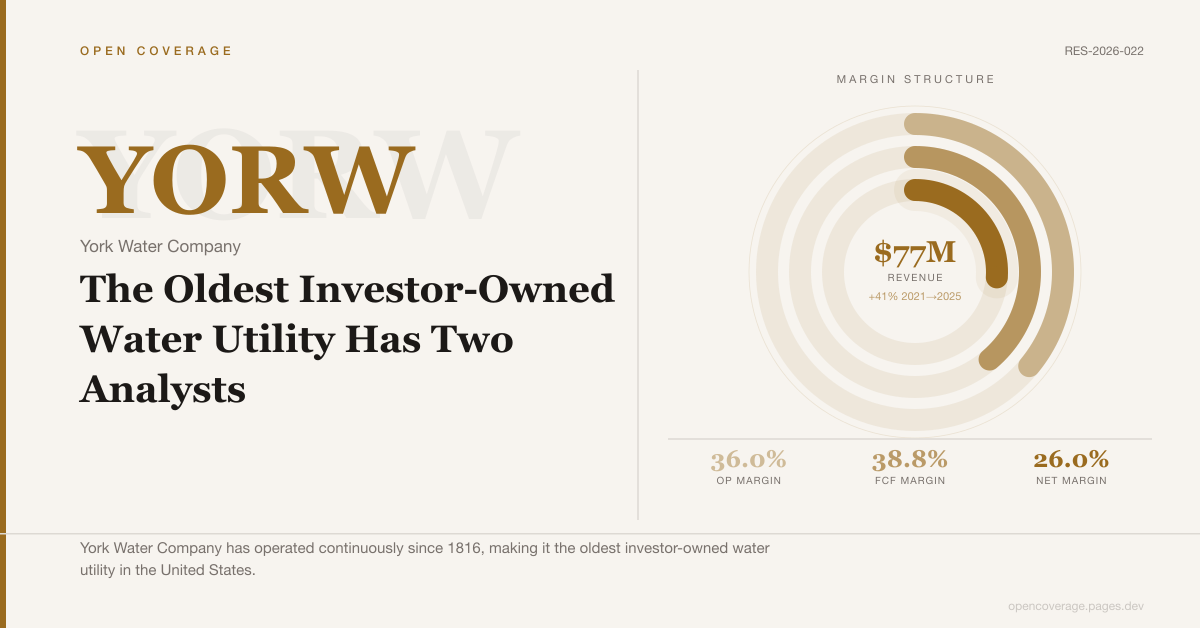
York Water Company (YORW): The Oldest Investor-Owned Water Utility Has Two Analysts
The oldest investor-owned water utility in the United States has operated continuously since 1816. A PPUC-regulated monopoly across four Pennsylvania counties and a 14.4M-share float limit the sell-side incentive to cover it.
-
 LQDT Stock Analysis RES-2026-021 2026-08-02
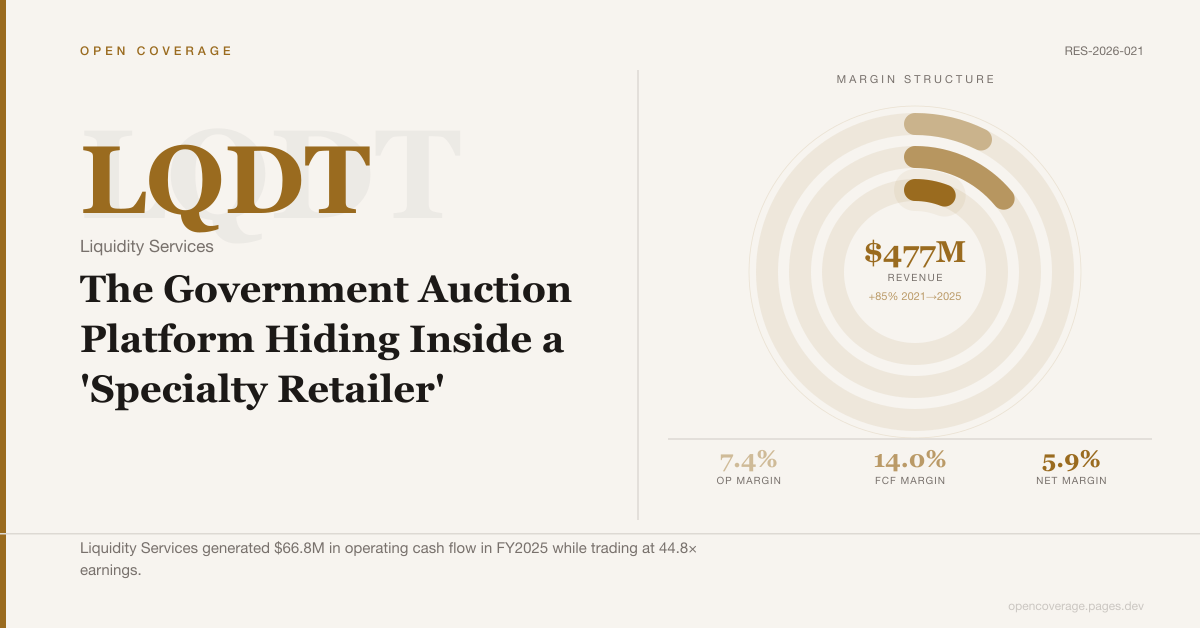
Liquidity Services (LQDT): The Government Auction Platform Hiding Inside a 'Specialty Retailer'
Liquidity Services runs GovDeals, the dominant U.S. online auction platform for government surplus — $903.5M in GMV and 92.7% direct profit margins in FY2025. FMP labels it 'Specialty Retail.' One analyst covers it.
-
 NC Stock Analysis RES-2026-020 2026-08-02
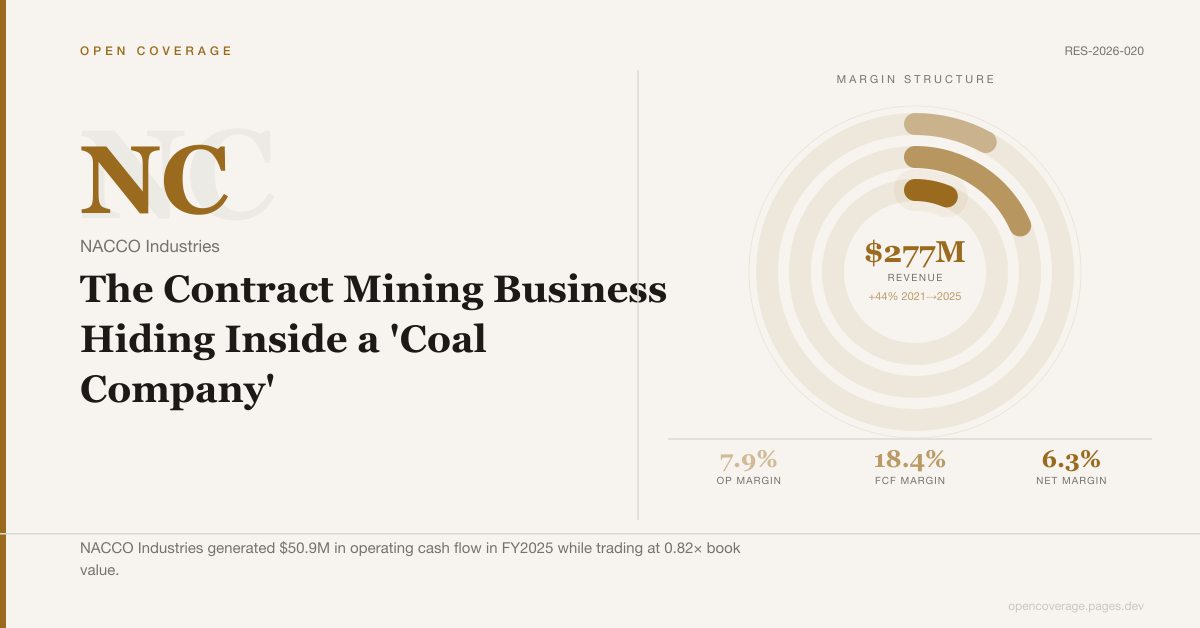
NACCO Industries (NC): The Contract Mining Business Hiding Inside a 'Coal Company'
NACCO Industries is labeled 'coal' — but NAMining, its contract mining services division for aggregates, lithium, and activated carbon, is now the majority revenue segment. ESG exclusions and a non-cash 2023 impairment charge have combined to push the stock to 0.82× book value and a 14.5% operating cash flow yield.
-
 UTMD Stock Analysis RES-2026-019 2026-07-31
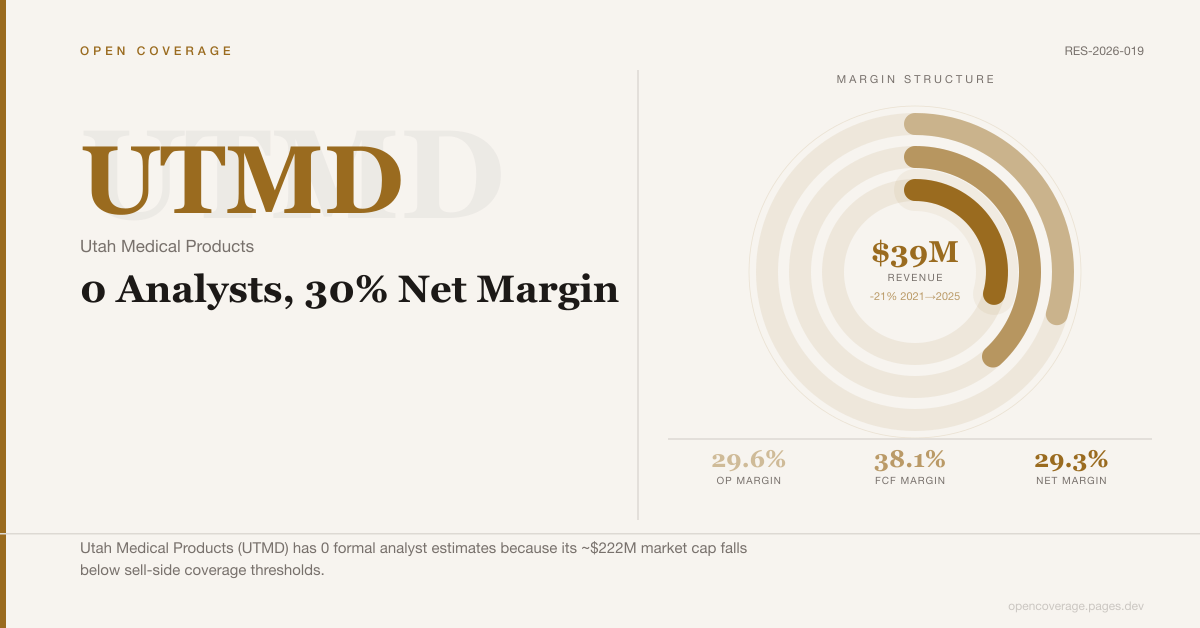
Utah Medical Products (UTMD): 0 Analysts, 30% Net Margin
UTMD has 0 formal analyst estimates despite 29–31% net income margins sustained into 1H 2026. At $87.5M cash and ~$222M market cap, the company sits below sell-side coverage thresholds — and the ongoing revenue decline reflects an unwinding customer base, not the core clinical franchise.
-
 WEYS Stock Analysis RES-2026-018 2026-07-30
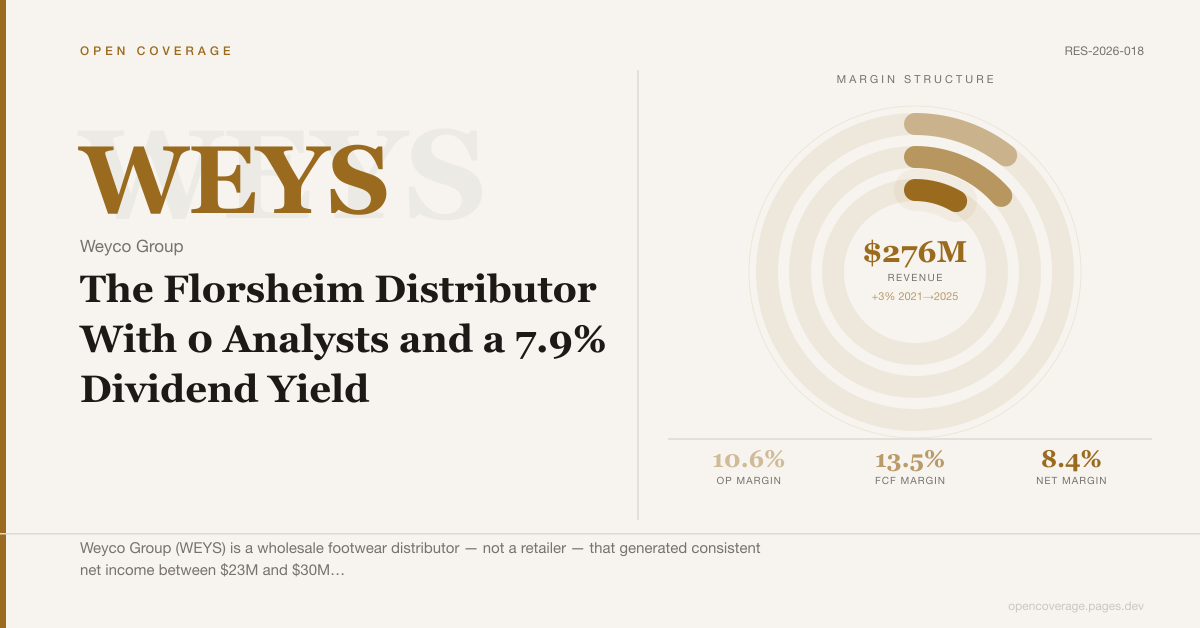
Weyco Group (WEYS): The Florsheim Distributor With 0 Analysts and a 7.9% Dividend Yield
Weyco Group is a wholesale footwear distributor where the Florsheim family holds a 36% controlling block. With no formal analyst coverage, $100.9M in cash and marketable securities, zero debt, and a dividend yield near 8%, the stock prices the revenue decline but not the cash cushion or the Florsheim brand's record performance.
-
 OFLX Stock Analysis RES-2026-017 2026-07-27
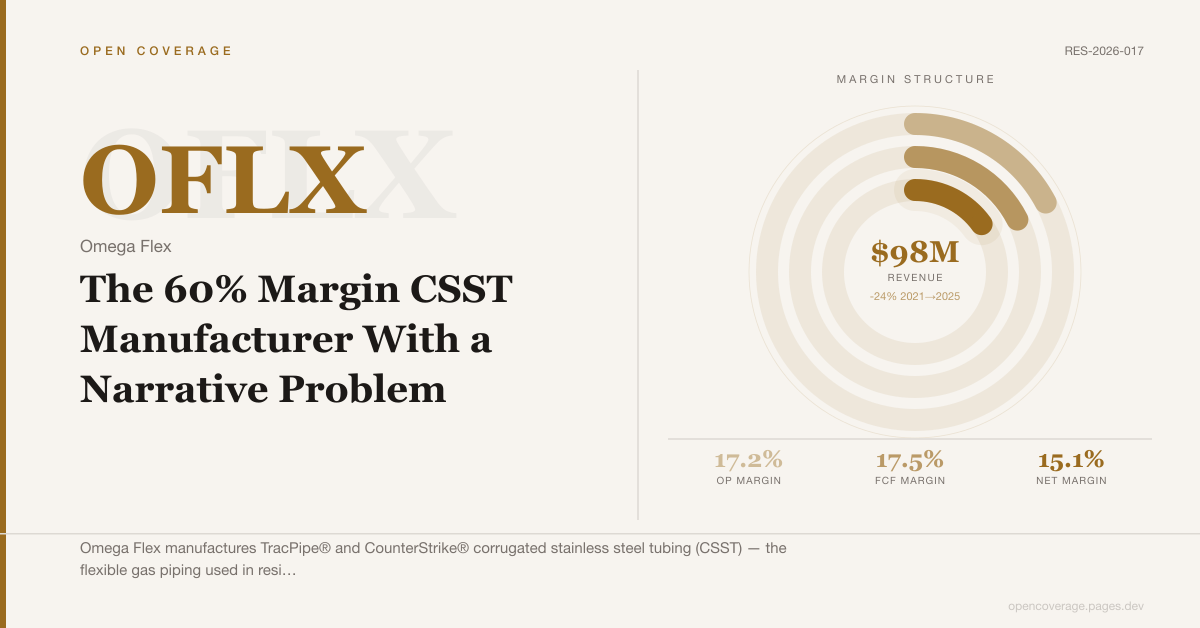
Omega Flex (OFLX): The 60% Margin CSST Manufacturer With a Narrative Problem
Omega Flex pioneered flexible gas piping for U.S. residential construction and holds 120+ patents on the technology. The Reed family's 56% stake makes the stock uninstitutional. The gas ban narrative is presented as a growth-ceiling — but whether that attribution explains the five-year revenue decline is precisely what the market hasn't resolved.
-
 Sector 2026-07-24
The Screening Blind Spot: Why Small Financial Institutions Disappear from Every Screener
Community banks, savings institutions, and small insurance companies share a structural problem: the tools used to find stocks systematically exclude them. Understanding the mechanics explains both the coverage gap and the opportunity.
-
 Education 2026-07-24
Net Interest Margin: What It Measures, How It Cycles, and Why Screeners Miss the Turn
NIM is the fundamental profitability metric for banks — and the reason a screener using trailing earnings removes a bank from consideration at exactly the moment when the thesis becomes most interesting.
-
 PLPC Stock Analysis RES-2026-016 2026-07-24
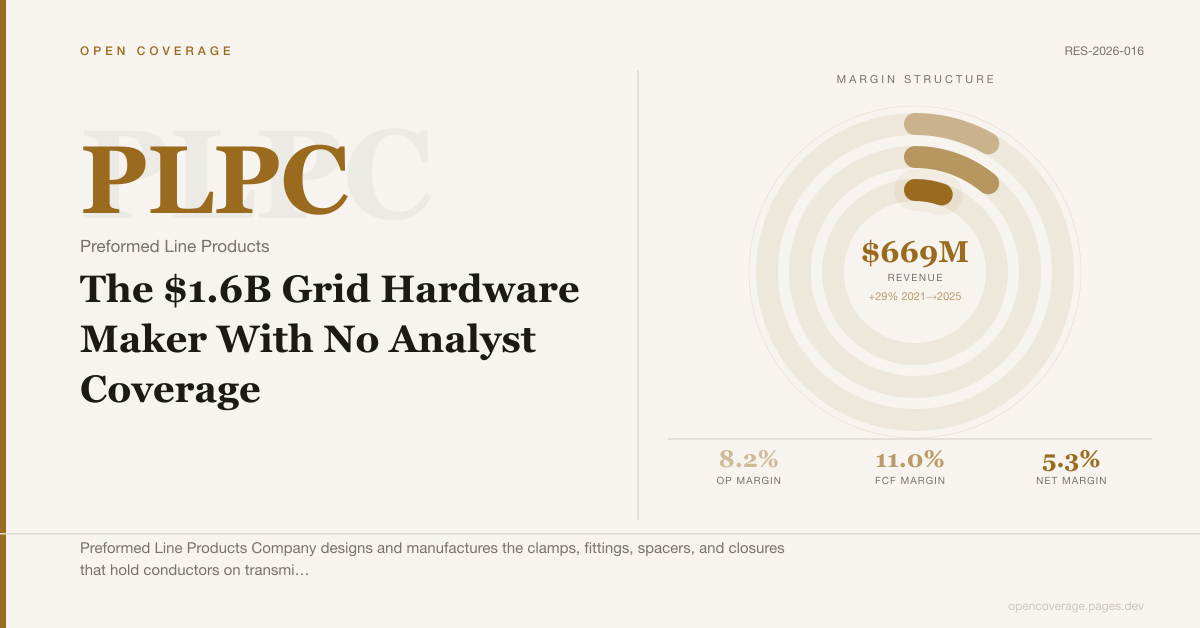
Preformed Line Products (PLPC): The $1.6B Grid Hardware Maker With No Analyst Coverage
Preformed Line Products makes the hardware that holds power lines to transmission towers. With the Ruhlman family controlling 33% of shares, the stock trades thinly enough that no institutional analyst covers it — despite a 22% backlog increase and the first dividend raise since its 1999 NASDAQ listing.
-
 CIX Stock Analysis RES-2026-014 2026-07-21
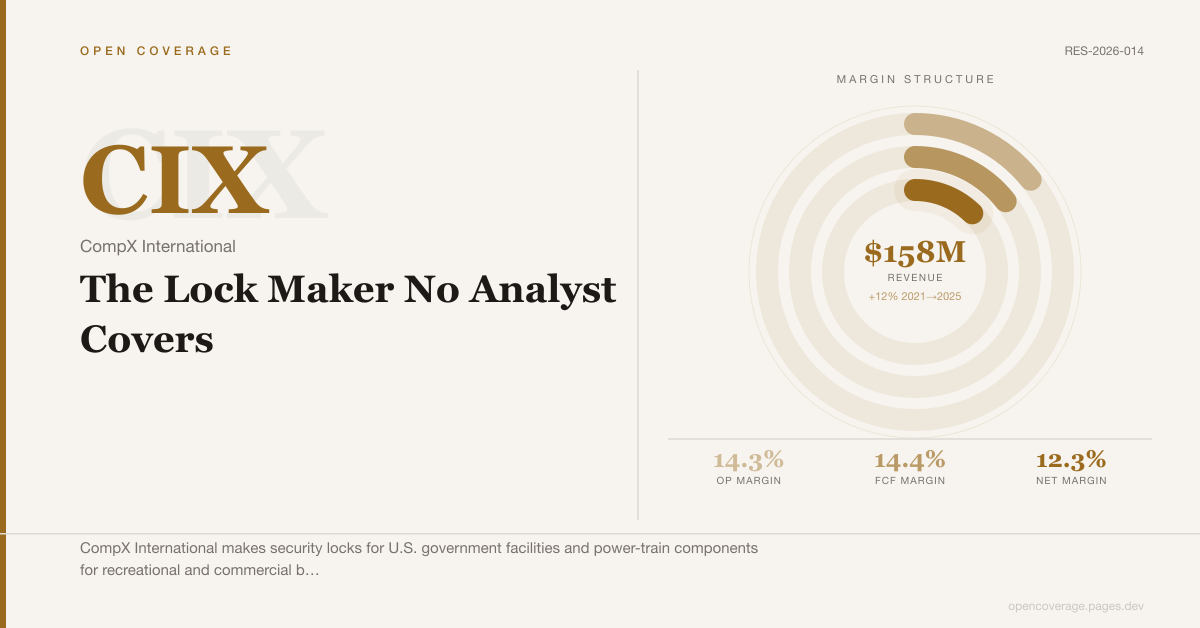
CompX International (CIX): The Lock Maker No Analyst Covers
A Dallas-area manufacturer of security locks and marine components, 87% owned by the Contran/Simmons family, trading on NYSE American with zero analyst coverage — invisible to institutional screeners by design.
-
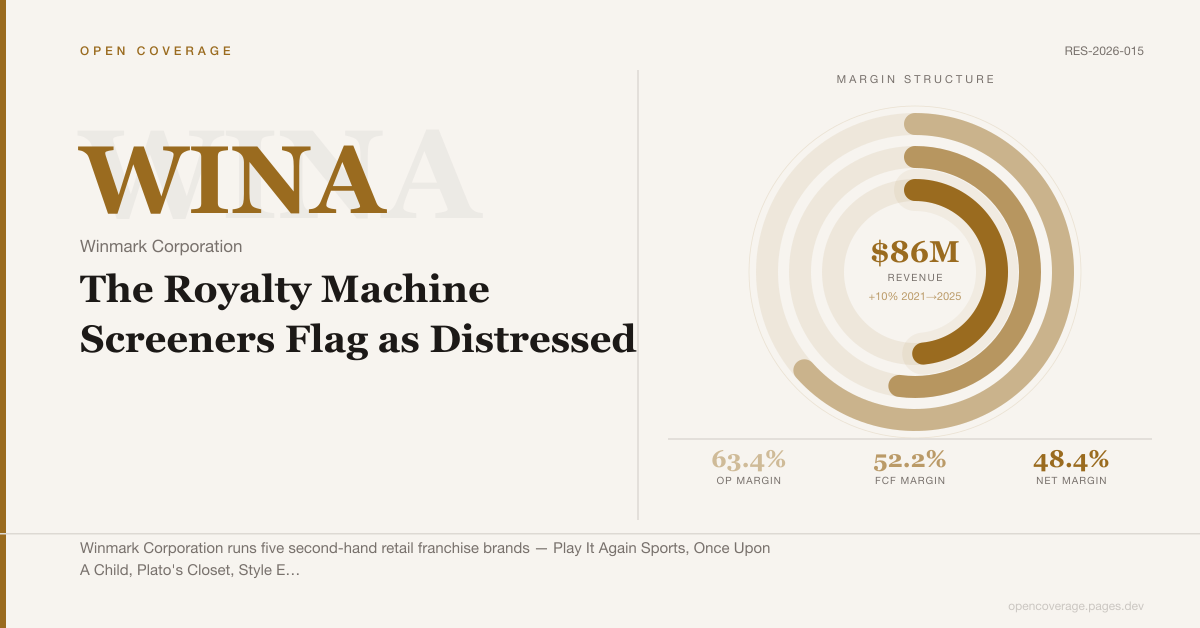 WINA Stock Analysis RES-2026-015 2026-07-21
Winmark Corporation (WINA): The Royalty Machine Screeners Flag as Distressed
Winmark collects royalties from 1,378 franchised second-hand retail locations with 87 employees, earning $41.7M in FY2025 net income. Negative equity from a leveraged recapitalization causes most screens to filter it out — not business distress, a deliberate capital structure.
-
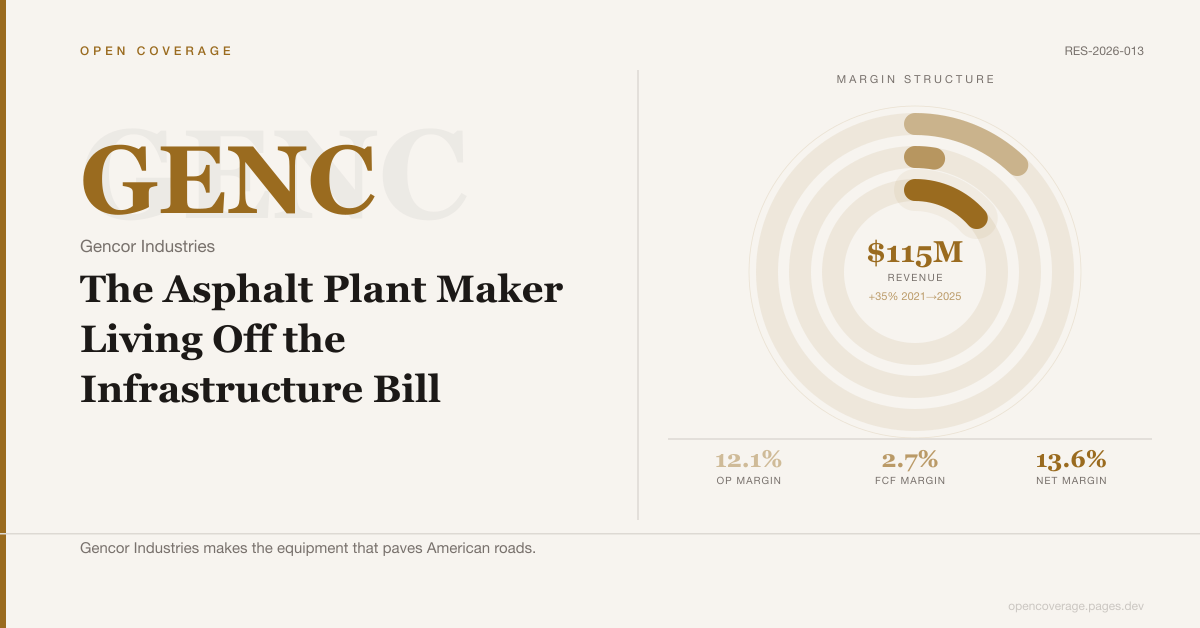 GENC Stock Analysis RES-2026-013 2026-07-19
Gencor Industries (GENC): The Asphalt Plant Maker Living Off the Infrastructure Bill
A debt-free Orlando manufacturer of hot-mix asphalt plants with one analyst estimate, a backlog that doubled year-over-year, and a dual-class share structure that keeps institutions away — while IIJA highway spending fills the order book.
-
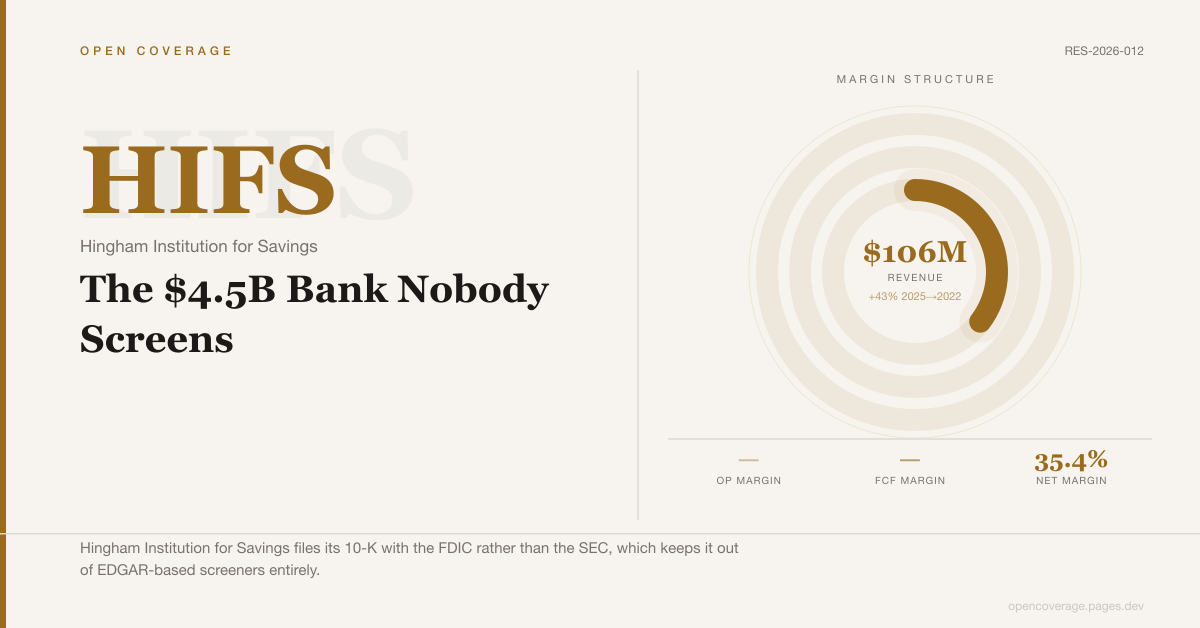 HIFS Stock Analysis RES-2026-012 2026-07-18
Hingham Institution for Savings (HIFS): The $4.5B Bank Nobody Screens
A Massachusetts savings bank founded in 1834 with 93 employees, no analyst coverage on standard feeds, and a net interest margin recovering from a two-year rate-cycle trough — invisible because it files with the FDIC, not the SEC.
-
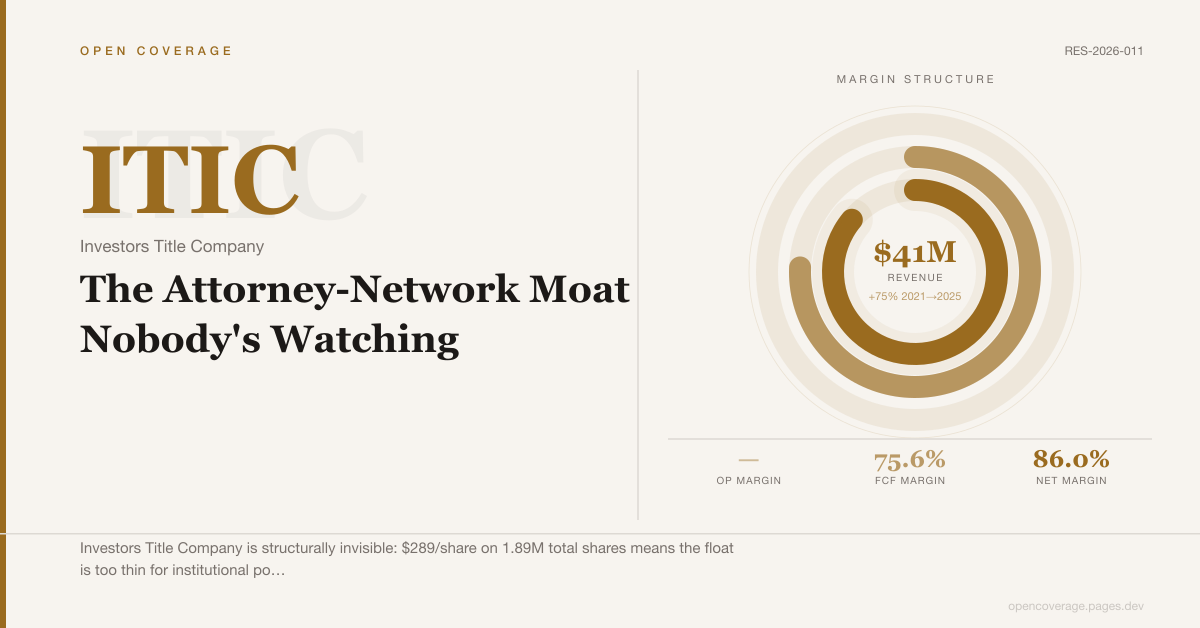 ITIC Stock Analysis RES-2026-011 2026-07-18
Investors Title Company (ITIC): The Attorney-Network Moat Nobody's Watching
A 50-year-old title insurance franchise controlled by the Fine family with 0 analyst estimates, 1.89M shares outstanding, and a 2.2% claims ratio that suggests unusually strong underwriting quality.
-
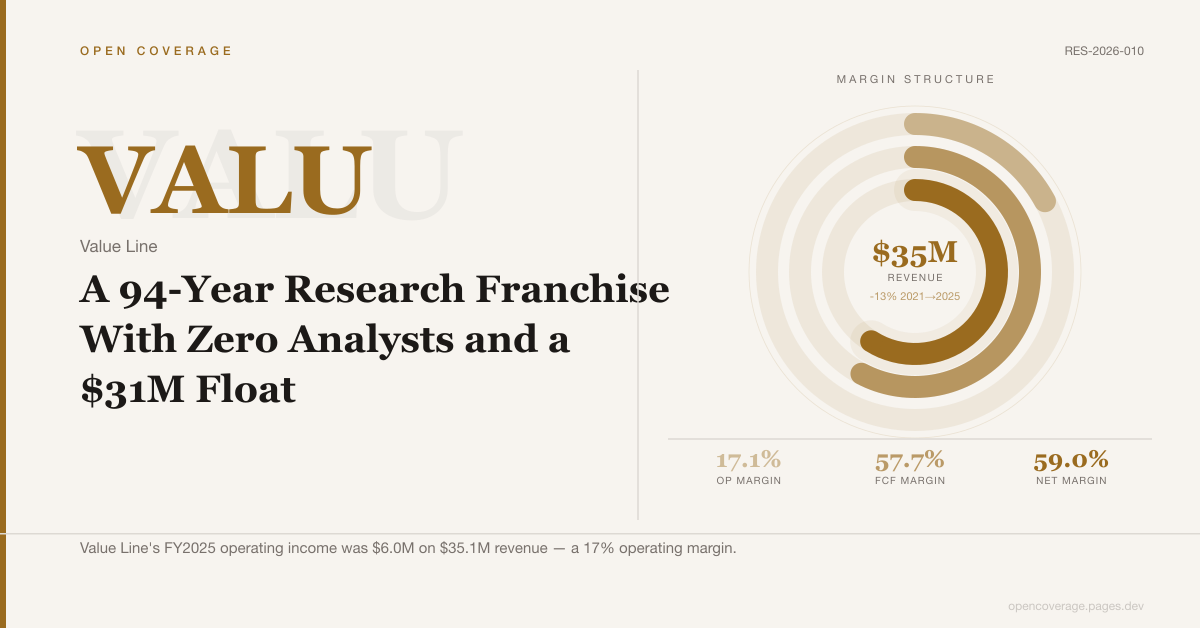 VALU Stock Analysis RES-2026-010 2026-07-18
Value Line (VALU): A 94-Year Research Franchise With Zero Analysts and a $31M Float
Value Line has published its Investment Survey since 1931, employs 117 people, and generates $20.7M in net income per year — yet carries 0 analyst estimates. The declining print revenue headline hides a copyright licensing stream embedded in ETFs and UITs, plus EAM non-voting income that accounts for most of the gap between a 17% operating margin and the 59% net margin.
-
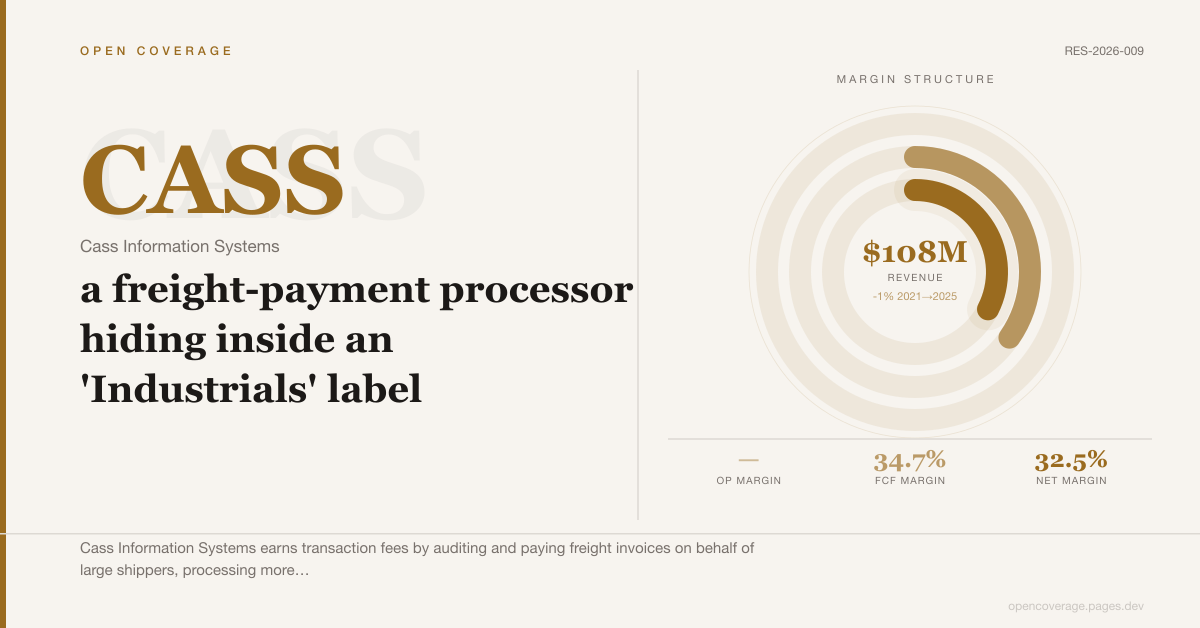 CASS Stock Analysis RES-2026-009 2026-07-17
Cass Information Systems (CASS): a freight-payment processor hiding inside an 'Industrials' label
A coverage-gap read on Cass Information Systems, a ~$698M freight-invoice auditor and payment processor that generates $1B+ in non-interest-bearing float, banks it through a subsidiary, and reported record FY2025 net income of $35.1M — while one analyst covers it and the data providers classify it as Industrials.
-
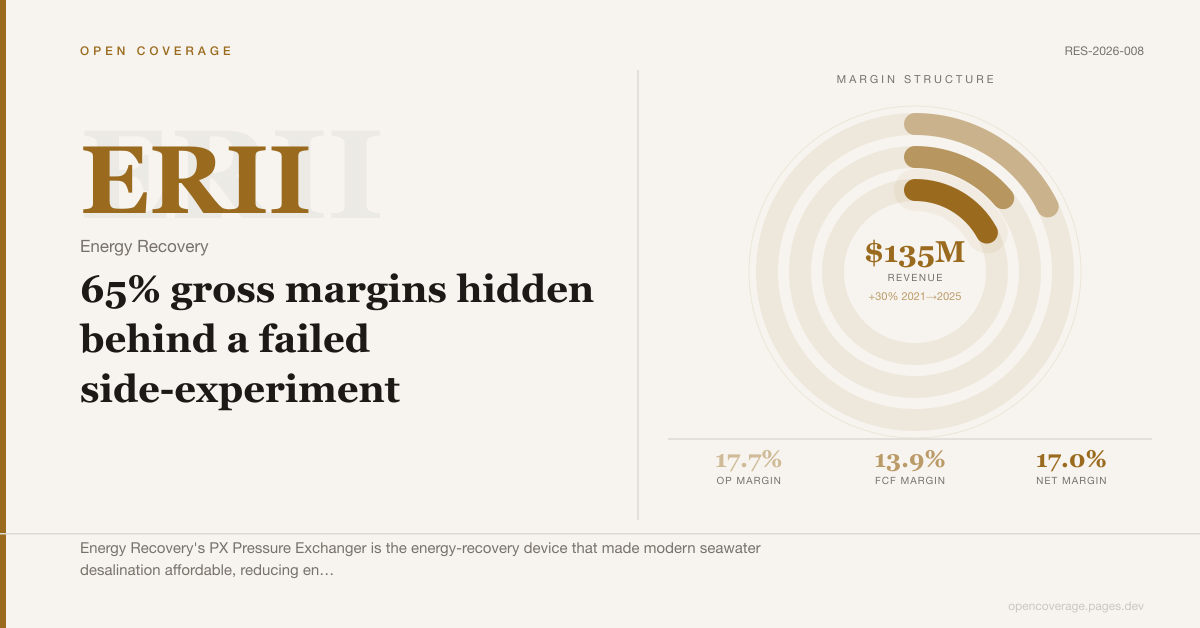 ERII Stock Analysis RES-2026-008 2026-07-17
Energy Recovery (ERII): 65% gross margins hidden behind a failed side-experiment
A coverage-gap read on Energy Recovery, a ~$460M near-monopoly in SWRO desalination pressure exchangers — priced at 20.5x trailing earnings on a reported Q1 2026 loss that is almost entirely one-time charges from winding down an unrelated CO2 business, while the core Water segment grew revenue 20% year-over-year.
-
 Sector 2026-07-17
Seawater desalination: the sector structure, who makes money, and where the niche opportunities are
Desalination converts seawater into freshwater at industrial scale. This is a sector overview of how the technology works, who the major players are, where the value concentrates in the supply chain, and what makes certain equipment niches disproportionately defensible.
-
 Education 2026-07-17
Three cases where the trailing P/E ratio actively misleads
The trailing price-to-earnings ratio is the most widely used stock valuation shortcut — and one of the easiest to misread. Here are the three situations where it gives the opposite signal from what is actually happening.
-
 HDSN Stock Analysis RES-2026-007 2026-07-16
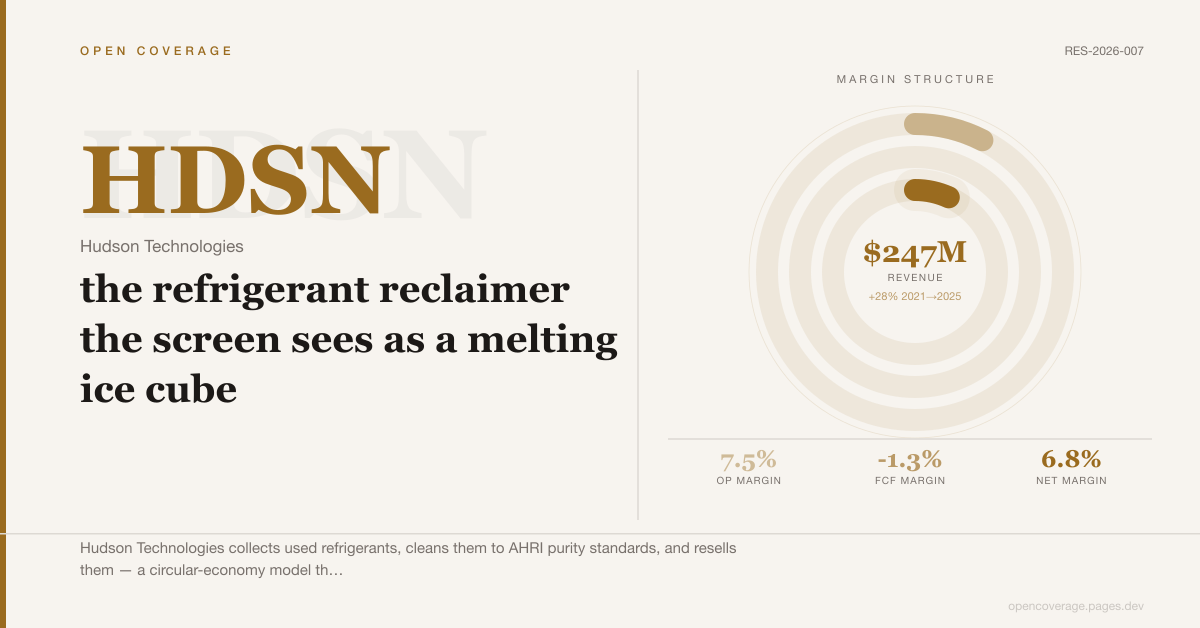
Hudson Technologies (HDSN): the refrigerant reclaimer the screen sees as a melting ice cube
A coverage-gap read on Hudson Technologies, a ~$262M refrigerant reclamation company whose earnings collapsed 84% from a 2022 price spike — leaving trailing screens convinced it is in structural decline at the exact moment EPA regulation mandates the use of reclaimed refrigerant.
-
 Education 2026-07-11
Under-Covered vs. Correctly Ignored: How to Tell the Difference
A framework for separating a genuine coverage gap from a stock the market is right to skip — the same screen we run before any name makes it onto our research queue.
-
 ISTR Stock Analysis RES-2026-005 2026-07-11
Investar Holding (ISTR): a serial acquirer mid-digestion, priced on numbers it won't fully show
A coverage-gap read on Investar Holding, a Louisiana regional bank that just closed its largest-ever acquisition — adding 40% to a now-$3.9B balance sheet — while declining to disclose pro forma results, and got mechanically sold out of a Russell small-cap index the same quarter.
-
 KINS Stock Analysis RES-2026-004 2026-07-11
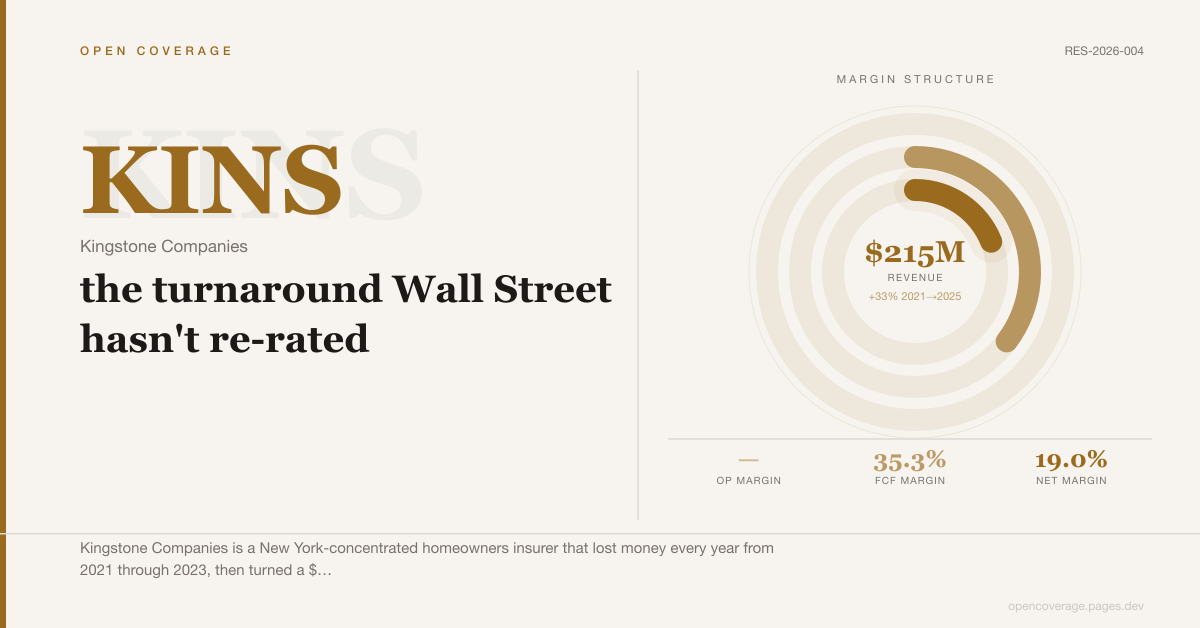
Kingstone Companies (KINS): the turnaround Wall Street hasn't re-rated
A coverage-gap read on Kingstone, a $293M New York homeowners insurer that posted three straight years of GAAP losses through 2023, then roughly doubled net income again in 2025 after a 2024 return to profit — while the stock still trades at roughly 7x trailing earnings.
-
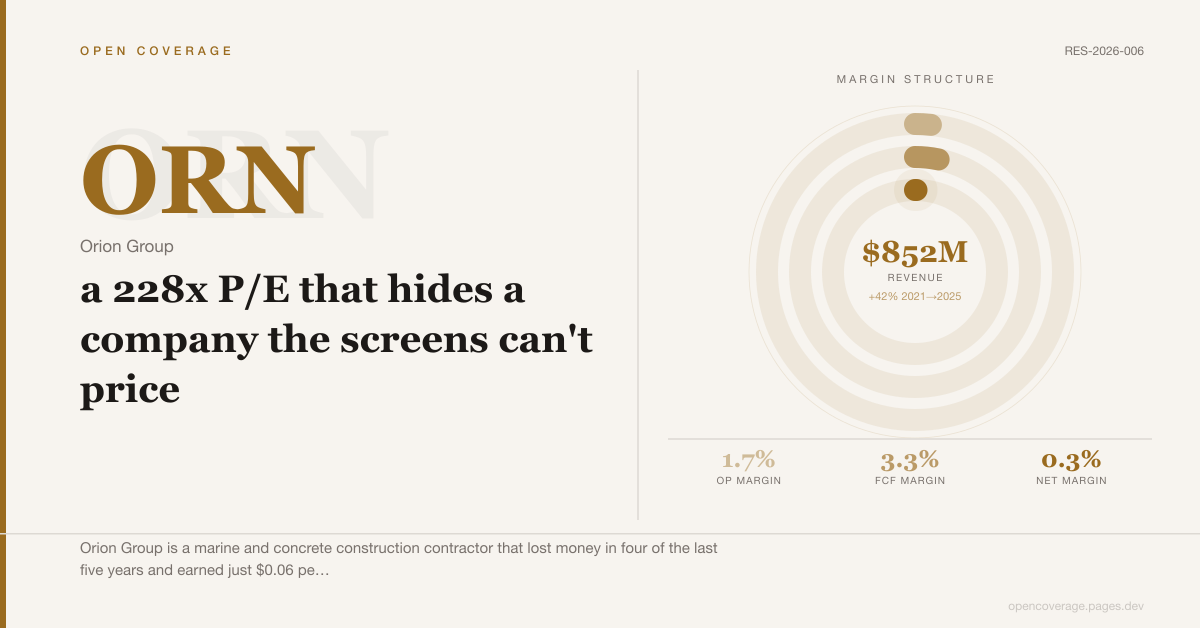 ORN Stock Analysis RES-2026-006 2026-07-11
Orion Group (ORN): a 228x P/E that hides a company the screens can't price
A coverage-gap read on Orion Group, a ~$555M marine-and-concrete constructor that just crossed into profitability after four straight loss years — leaving a headline P/E near 228x that makes every screen reject a business generating 10x that in operating cash flow.
-
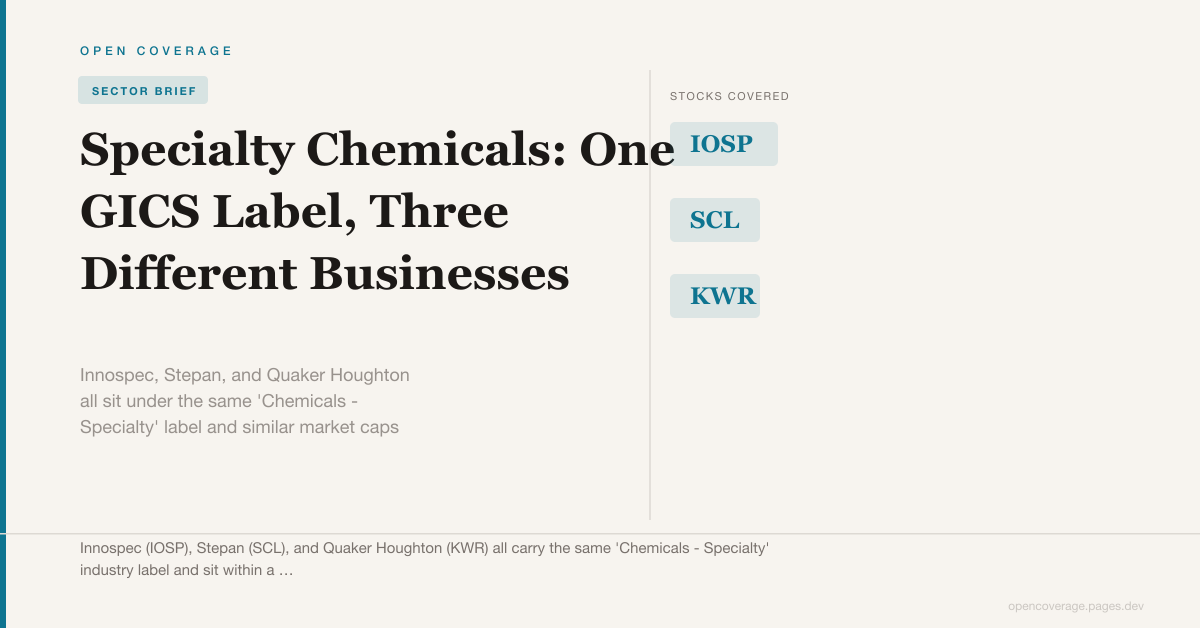 Sector 2026-07-11
Specialty Chemicals: One GICS Label, Three Different Businesses
Innospec, Stepan, and Quaker Houghton all sit under the same 'Chemicals - Specialty' label and similar market caps — but their FY2025 numbers describe three genuinely different businesses, not one sector story.
-
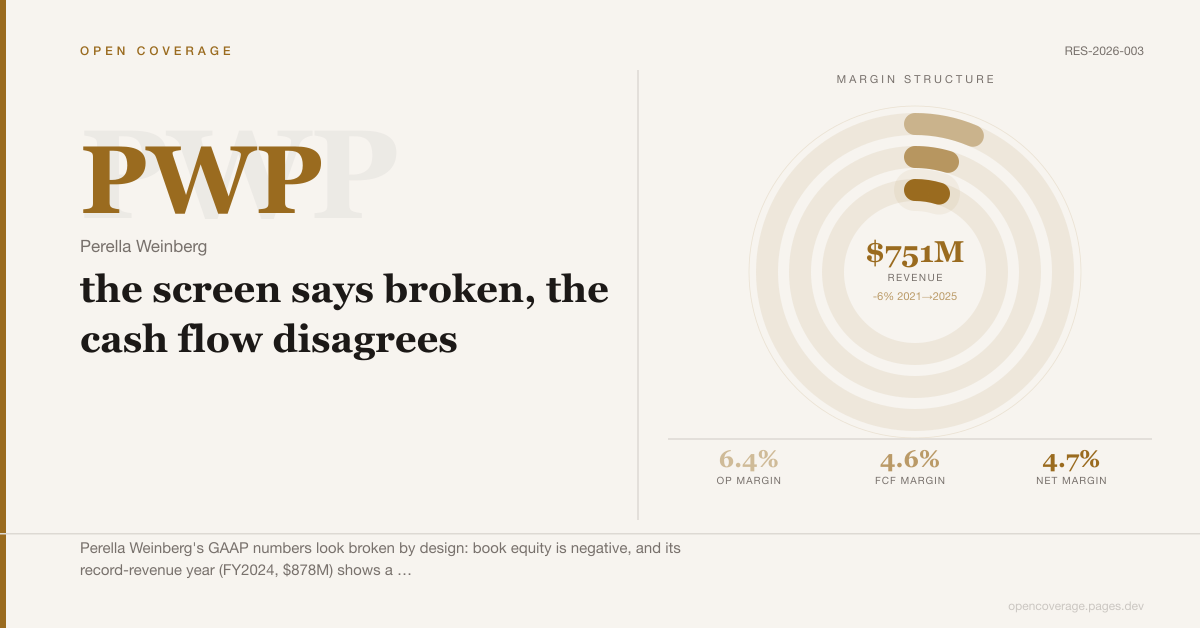 PWP Stock Analysis RES-2026-003 2026-07-06
Perella Weinberg (PWP): the screen says broken, the cash flow disagrees
A coverage-gap read on Perella Weinberg Partners — a $1.6B M&A advisory boutique whose Up-C accounting produces negative book equity and erratic GAAP earnings, the exact numbers that make quantitative screens discard it before anyone looks closer.
-
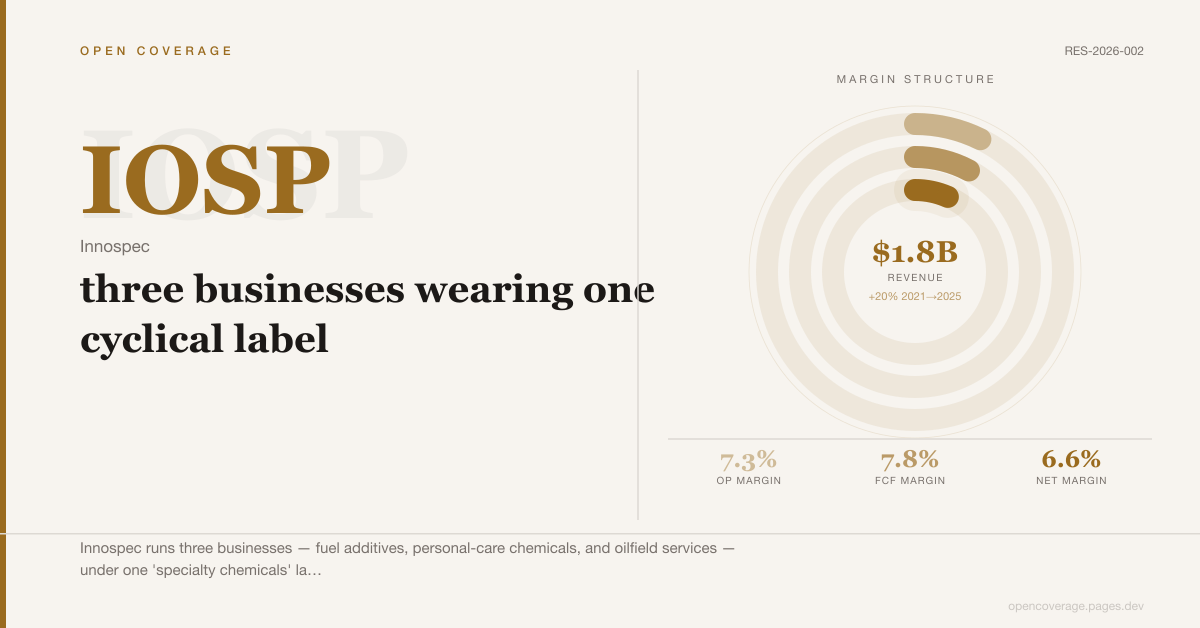 IOSP Stock Analysis RES-2026-002 2026-07-05
Innospec (IOSP): three businesses wearing one cyclical label
A coverage-gap read on Innospec — a $2B specialty-chemicals name whose fuel-additive, personal-care, and oilfield-services segments get priced as a single cyclical, and whose 2024 earnings crash looks more like a non-cash charge than a broken business.